The Nifty 50 index presents a challenging technical landscape as of July 29, 2025, with the benchmark trading at 24,680.90, displaying pronounced bearish momentum amid a confluence of negative technical indicators. This comprehensive analysis examines the critical support and resistance levels, technical indicators, and market dynamics that will likely influence the index’s movement on this crucial trading day.
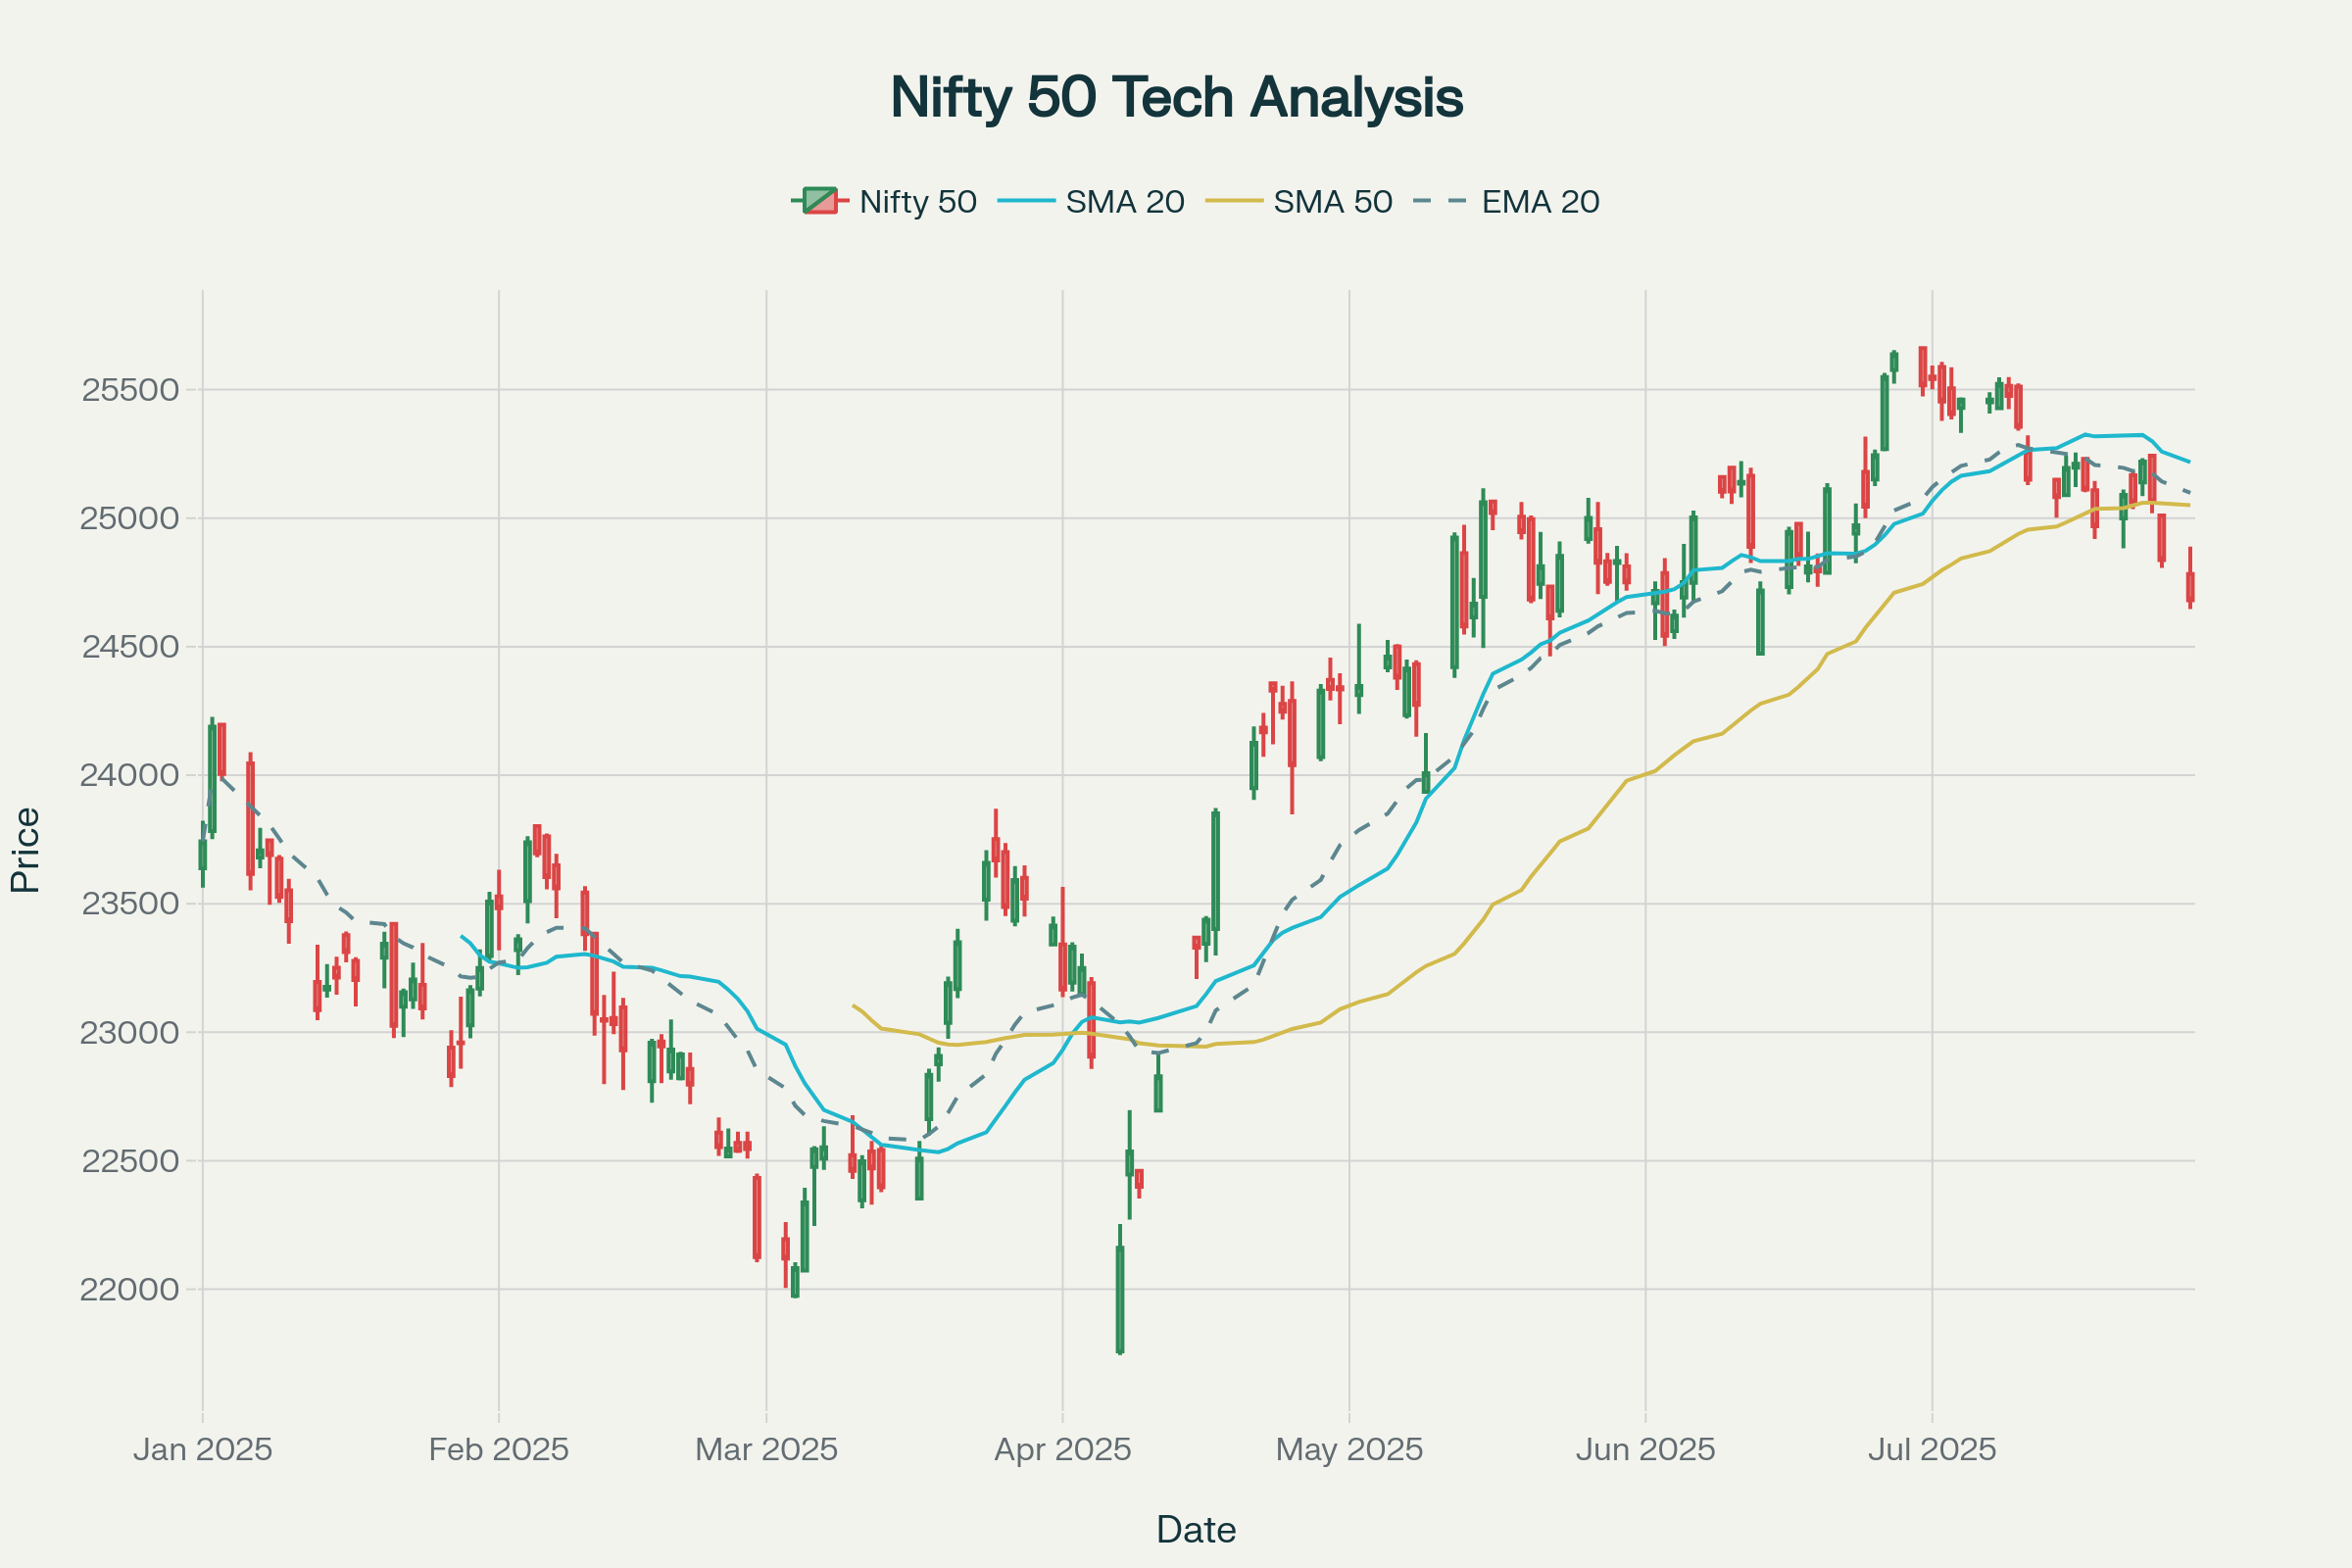
Nifty 50 Technical Analysis Chart: Price Action with Moving Averages, RSI, and MACD indicators showing current bearish trend and oversold conditions as of July 29, 2025
Current Market Position and Technical Overview
The Nifty 50 has experienced significant deterioration in its technical structure, declining over 550 points from the recent high of approximately 25,250 reached earlier in the week. The index currently trades at 24,680.90, representing a 0.63% decline from the previous session and marking the third consecutive day of losses12. This sustained selling pressure has pushed the index below all major moving averages, confirming the shift from a bullish to bearish technical environment.
The index’s year-to-date performance shows a modest gain of 3.95%, though this masks the significant volatility experienced throughout 20253. The 52-week trading range spans from a high of 26,277.35 to a low of 21,743.65, with the current price level positioned closer to the lower end of this range, indicating substantial weakness in market sentiment4.
Technical Indicators Analysis
Moving Average Configuration
The technical analysis reveals a distinctly bearish moving average setup that underscores the deteriorating market structure. The Nifty 50 currently trades at 24,680.90, significantly below the 20-day Simple Moving Average (SMA) at 25,217.40 and the 50-day SMA at 25,050.875. The 20-day Exponential Moving Average (EMA) at 25,098.59 also acts as resistance, creating a formidable barrier for any potential recovery attempts.
This configuration, where the price trades below all key moving averages with the shorter-term averages below the longer-term ones, indicates a classic bearish trend reversal. The crossover of the 5-day and 20-day moving averages has generated additional selling signals, reinforcing the negative technical outlook6.
Momentum Oscillators
The Relative Strength Index (RSI) at 24.71 has entered deeply oversold territory, falling well below the traditional oversold threshold of 305. This extreme reading suggests that the recent selling pressure may have been overdone, potentially setting the stage for a technical bounce. However, RSI can remain in oversold conditions for extended periods during strong bearish trends, limiting its reliability as a standalone reversal signal.
The Moving Average Convergence Divergence (MACD) indicator presents a strongly bearish picture, with the MACD line at -52.79 trading significantly below the signal line at 20.885. The MACD histogram at -73.67 indicates accelerating bearish momentum, suggesting that the downtrend may continue in the near term.
Volume Analysis and Market Breadth
Trading volumes have remained elevated during the recent decline, with the July 28 session recording 262.14 million shares traded7. This high volume accompanying the price decline suggests genuine selling pressure rather than a mere technical correction. The sustained volume levels indicate that institutional participants are actively reducing their equity exposure, contributing to the bearish momentum.
Market breadth has deteriorated significantly, with only 6 stocks out of the Nifty 50 constituents posting gains in the recent session8. This broad-based weakness across index components reinforces the negative market sentiment and suggests that the decline is not confined to specific sectors or stocks.
Critical Support and Resistance Levels
Immediate Support Zones
The immediate support for the Nifty 50 is positioned at 24,600, which represents a psychologically important level and has been identified by multiple technical analysts as a critical floor910. This level coincides with the maximum put open interest, indicating strong institutional support2. A breakdown below this level could trigger additional selling pressure, potentially driving the index toward the next support zone at 24,500-24,55011.
The more significant support lies at 24,473, representing the June 13 low, which serves as a crucial technical benchmark. A decisive break below this level would signal a deeper correction and could open the path toward 24,000, a major psychological support level that has historical significance.
Key Resistance Levels
On the upside, the index faces immediate resistance at 24,800, which represents the level where fresh selling pressure is likely to emerge9. This level has been reinforced by option positioning, with significant call writing observed at the 24,800 strike price9.
The more substantial resistance is positioned at 24,950-25,000, representing the convergence of multiple technical factors including prior support turned resistance and the psychological 25,000 level6. A sustained move above 25,100-25,200 would be required to signal a potential trend reversal and attract meaningful buying interest1.
Market Sentiment and External Factors
Foreign and Domestic Institutional Activity
Foreign Institutional Investor (FII) selling pressure continues to weigh heavily on market sentiment, with FIIs remaining net sellers for the sixth consecutive session, offloading shares worth ₹6,082.5 crore on July 282. The month-to-date FII outflow has reached ₹36,591 crore, creating sustained selling pressure across the market7.
Conversely, Domestic Institutional Investors (DIIs) have provided crucial support, acquiring shares worth ₹6,764.6 crore in the recent session and maintaining their buyer status for 16 consecutive sessions2. This divergence between FII selling and DII buying has helped prevent a more severe market decline but has not been sufficient to reverse the negative trend.
Global Market Dynamics
The global market environment presents mixed signals for Indian equities. While US markets have shown resilience with the S&P 500 and Nasdaq posting record highs, Asian markets have displayed volatility amid ongoing trade tensions and economic uncertainties12. The Japan-US trade agreement, which reduced tariffs from 25% to 15%, has provided some positive sentiment, but concerns about US-China trade relations continue to create headwinds13.
The European Central Bank’s decision to maintain interest rates unchanged while signaling caution about future policy moves reflects the broader global economic uncertainty that continues to influence emerging market flows13.
Sectoral Performance and Earnings Impact
Banking and Financial Services
The banking sector has emerged as a significant drag on the Nifty 50, with Bank Nifty declining 444 points and breaking below key technical levels10. Kotak Mahindra Bank’s disappointing quarterly results, which led to a 6-7% decline in the stock, have created negative sentiment across the banking space11. The sector’s weakness is particularly concerning given its substantial weight in the index.
Information Technology Sector
The IT sector continues to face headwinds, with major constituents like TCS declining approximately 1.6% amid reports of workforce restructuring11. The sector’s underperformance reflects concerns about global demand softening and the impact of protectionist trade policies on technology services exports.
Pharmaceutical Sector Outperformance
In contrast to the broader market weakness, the pharmaceutical sector has demonstrated resilience, with stocks like Cipla posting gains of over 3%8. This sector rotation suggests that investors are seeking defensive positions amid the broader market uncertainty.
Predictions and Trading Strategy for July 29, 2025
Intraday Outlook
Based on the comprehensive technical analysis, the Nifty 50 is likely to experience continued pressure on July 29, 2025. The index is expected to face resistance at 24,800, with any rally likely to be met with fresh selling pressure9. The critical support at 24,600 will be closely watched, as a breakdown could accelerate the decline toward 24,50010.
The technical setup suggests a trading range between 24,500-24,850 for the session, with a bearish bias given the momentum indicators and market sentiment10. Traders should be prepared for increased volatility as the index approaches these critical levels.
Key Inflection Points
July 29 has been identified by technical analysts as a potential inflection point, with time-based analytics suggesting possible trend reversal or continuation signals14. The interaction between the current price level and the critical support at 24,600 will likely determine the near-term direction.
A decisive break below 24,600 with sustained volume could trigger a more significant correction toward 24,400-24,500, while a bounce from this level might provide temporary relief toward 24,750-24,8009.
Risk Management Considerations
Given the elevated volatility and uncertain market conditions, risk management becomes paramount. Position sizing should be conservative, with stop-loss levels clearly defined. Long positions should consider stops below 24,550, while short positions might target the 24,400-24,500 zone with stops above 24,8509.
The high implied volatility, as evidenced by the India VIX rising 6.98% to 12.06, suggests that option strategies might be more effective than directional bets in the current environment10.
Medium-Term Technical Outlook
Weekly and Monthly Perspective
From a broader perspective, the Nifty 50 has completed its fourth consecutive week of losses, with the weekly chart showing increasing bearish momentum14. The monthly chart indicates that July 2025 could be the worst-performing month since 2019, breaking the four-month winning streak11.
The index’s position relative to its long-term moving averages suggests that any recovery will likely be gradual and face multiple resistance levels. The 25,200-25,400 zone represents a significant resistance area that would need to be reclaimed for a meaningful trend reversal6.
Earnings Season Impact
The ongoing Q1 FY26 earnings season continues to influence market sentiment, with mixed results from major companies creating uncertainty about corporate profitability trends. The earnings-driven volatility is likely to persist, adding to the technical challenges facing the index.
Conclusion
The Nifty 50’s technical analysis for July 29, 2025, presents a predominantly bearish outlook characterized by oversold conditions, negative momentum indicators, and sustained institutional selling pressure. While the extreme RSI reading suggests potential for a technical bounce, the overall trend structure remains negative with significant resistance levels capping any recovery attempts.
The critical support at 24,600 and resistance at 24,800 will define the near-term trading range, with a breakdown below support likely to accelerate the decline toward deeper correction levels. Market participants should remain cautious and employ appropriate risk management strategies while navigating this challenging technical environment.
The confluence of domestic earnings concerns, global trade uncertainties, and persistent FII selling creates a complex backdrop that favors defensive positioning over aggressive bullish bets. Any trading decisions should carefully consider the elevated volatility and the potential for continued weakness in the near term.
- https://www.perplexity.ai/finance/^NSEI
- https://ticker.finology.in/market/index/nse/nifty
- https://www.niftyindices.com
- https://in.tradingview.com/symbols/NSE-NIFTY/technicals/
- https://www.screener.in/company/NIFTY/
- https://www.nseindia.com
- https://in.investing.com/indices/s-p-cnx-nifty-technical
- https://en.wikipedia.org/wiki/NIFTY_50
- https://www.moneycontrol.com/indian-indices/nifty-50-9.html
- https://www.moneycontrol.com/technical-analysis/indian-indices/nifty-50-9/daily
- https://www.nseindia.com/products-services/indices-nifty50-index
- https://groww.in/charts/indices/nifty
- https://groww.in/indices/nifty
- https://economictimes.indiatimes.com/markets/technical-charts
- https://in.tradingview.com/symbols/NSE-NIFTY/
- https://www.topstockresearch.com/rt/Stock/NIFTY/TechnicalAnalysis
- https://www.niftyindices.com/indices/equity/broad-based-indices/NIFTY-Next-50/NIFTY-50
- https://www.tickertape.in/indices/nifty-50-index-.NSEI
- https://finance.yahoo.com/quote/%5ENSEI/
- https://www.cnbc.com/quotes/.NSEI
- https://bigul.co/blog/market-update/nifty-50-and-bank-nifty-outlook-for-july-24-2025
- https://economictimes.com/markets/stocks/news/july-29-could-be-the-game-changer-stay-tuned-for-trend-reversal-says-harshubh-shah/articleshow/122943727.cms
- https://bigul.co/blog/market-update/nifty-50-and-bank-nifty-outlook-for-july-23-2025
- https://enrichmoney.in/nifty50-bank-nifty-sensex30-news-research-analysis-chart
- https://www.spidersoftwareindia.com/blog/stock-market-prediction-for-nifty-bank-nifty-29th-july-2025/
- https://www.ndtvprofit.com/markets/trade-setup-nse-nifty-50-support-resistance-levels-outlook-july-21-2025
- https://www.optionchainindia.com/blog/technical-analysis-4/24th-july-25-110
- https://choiceindia.com/blog/market-prediction-today
- https://www.goodreturns.in/news/sensex-nifty-prediction-july-28-aug-1-bearish-momentum-builds-as-stock-market-faces-key-support-t-1445273.html
- https://www.youtube.com/watch?v=FSM5ZCyXkgE
- https://www.youtube.com/watch?v=qWEnax6rxVo
- https://www.moneycontrol.com/news/business/markets/trade-setup-for-july-29-top-15-things-to-know-before-the-opening-bells-13339587.html
- https://www.youtube.com/watch?v=FR2SxijwknU
- https://www.5paisa.com/blog/sensex-nifty-stock-market-live-updates-july-29-2025
- https://www.youtube.com/watch?v=-1W_UOA_Zd8
- https://brameshtechanalysis.com/2025/07/27/nifty-weekly-astro-trading-21-25-july-2025-forecast/
- https://www.thehindubusinessline.com/portfolio/technical-analysis/nifty-prediction-today-july-28-2025-nifty-50-july-futures-key-support-ahead-avoid-fresh-short-positions/article69864040.ece
- https://www.editorji.com/business-news/markets/nse-nifty-50-top-gainers-what-are-the-5-biggest-stock-gainers-today-july-28-2025-1753698977302
- https://www.financialexpress.com/market/how-will-markets-open-today-gift-nifty-up-us-futures-flat-and-6-other-cues-to-watch-at-this-hour-3929568/
- https://www.moneycontrol.com/stocks/marketstats/fii_dii_activity/index.php
- https://www.ndtvprofit.com/markets/stock-market-today-all-you-need-to-know-going-into-trade-on-july-29-2025
- https://www.traderscockpit.com/?pageView=fii-dii-activity
- https://www.cnbctv18.com/market/stock-market-live-updatres-sensex-nifty-50-today-midcaps-banks-indusind-maz-dock-gail-piramal-pharma-waaree-asian-paints-lt-ntpc-green-share-price-liveblog-19644930.htm
- https://groww.in/fii-dii-data
- https://www.nseindia.com/reports/fii-dii
- https://www.nseindia.com/companies-listing/corporate-filings-event-calendar
- https://www.screener.in/screens/675072/fii-dii-buying/
- https://www.cnbctv18.com/market/trade-setup-july-29-nifty-enters-oversold-territory-but-positive-triggers-remain-elusive-indusind-bank-shares-19644829.htm
- https://www.thehindubusinessline.com/markets/share-market-nifty-sensex-live-updates-28-july-2025/article69861521.ece
- https://web.sensibull.com/fii-dii-data
- https://www.moneycontrol.com/news/business/markets/stock-market-live-sensex-nifty-50-share-price-gift-nifty-latest-updates-29-07-2025-liveblog-13340445.html
- https://web.stockedge.com/fii-activity
- https://www.moneycontrol.com/news/business/markets/first-tick-here-are-the-top-global-cues-for-today-s-trade-145-13336590.html
- https://bigul.co/blog/market-update/nifty-and-bank-nifty-weekly-outlook-from-july-21-to-july-25-2025
- https://www.ig.com/en/news-and-trade-ideas/weekly-market-navigator–28-jul-2025-250728
- https://economic-research.bnpparibas.com/html/en-US/updated-scenario-forecasts-Economic-Research-15-July-2025-7/15/2025,51187
- https://www.5paisa.com/blog/nifty-outlook
- https://www.spglobal.com/marketintelligence/en/mi/research-analysis/week-ahead-economic-preview-week-of-28-july-2025.html
- https://www.interactivebrokers.com/campus/traders-insight/securities/macro/economic-update-week-of-july-28-2025/
- https://economictimes.com/markets/stocks/live-blog/bse-sensex-today-live-nifty-stock-market-updates-28-july-2025/liveblog/122942974.cms
- https://equalsmoney.com/economic-calendar/july
- https://www.thehindubusinessline.com/markets/share-market-today-nifty-sensex-live-updates-05-march-2025/article69867804.ece
- https://www.thehindubusinessline.com/markets/stock-market-highlights-28-july-2025/article69861521.ece
- https://tradingeconomics.com/calendar
Disclaimer: The information provided on this website is for informational purposes only and should not be construed as financial or investment advice. Users are advised to do their own research and consult a qualified financial advisor before making any investment decisions.